Measurement and ANalysis of Internet Congestion
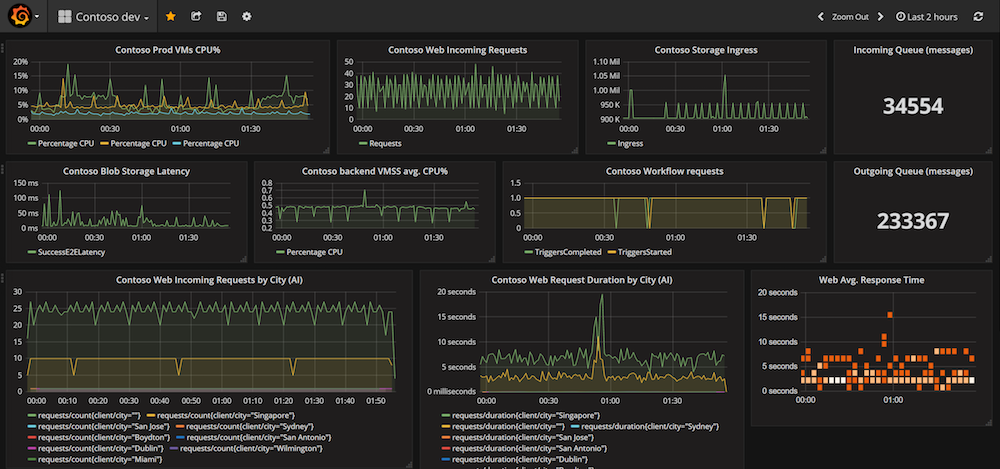
Time series front end
Manic API Documentation
This Grafana front end contains dashboards depicting latency time series to the endpoints of
interdomain links collected as part of the TSLP measurements. For access to the dashboards, contact
manic-info@caida.org This webpage presents the Manic-API documentation implemented with Swagger,
which allows users to experiment with queries through the API.